Basement Terminal

Selina Lee

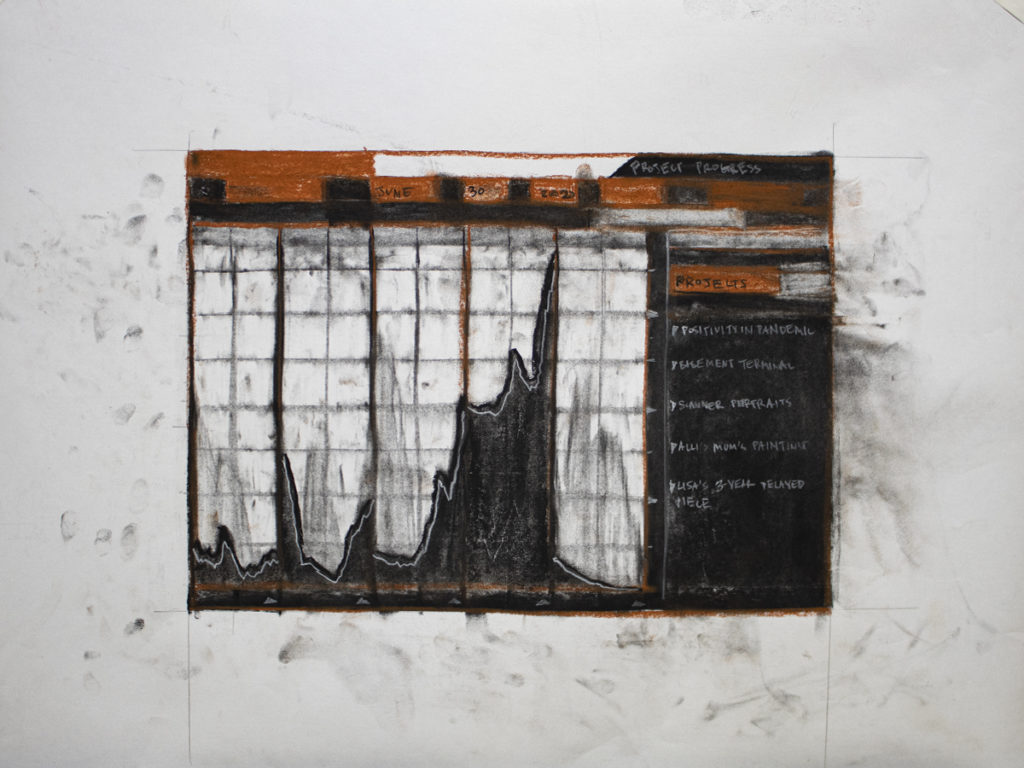
Basement Terminal is the manual analog of the Bloomberg Terminal, the $24,000 financial software which hosts exclusive market data on a black interface. Located in the artist’s basement, Basement Terminal consists of ten charcoal drawings and counting that are updated by the erasure and addition of charcoal per visit. They depict Bloomberg’s famed economic visualizations, which use the artist’s personal data instead.

In sequential order, these drawings show: who the artist communicates with, what the biggest news headlines are for the artist and in the world, where the artist and their housemates are located during the day, how motivated the artist is, where the the artist goes to run, what the artist watches or reads, how often the artist updates the terminal, what type of work is available for the artist, how the artist’s artwork is developing, and where the artist uses their finances.

It’s your daily round-up created purely with muscle, and zero automation. As an outcome of economic anxiety and restless media statistics, this ongoing project illustrates an artist’s outlook on control and maintenance when our systems are in halt.
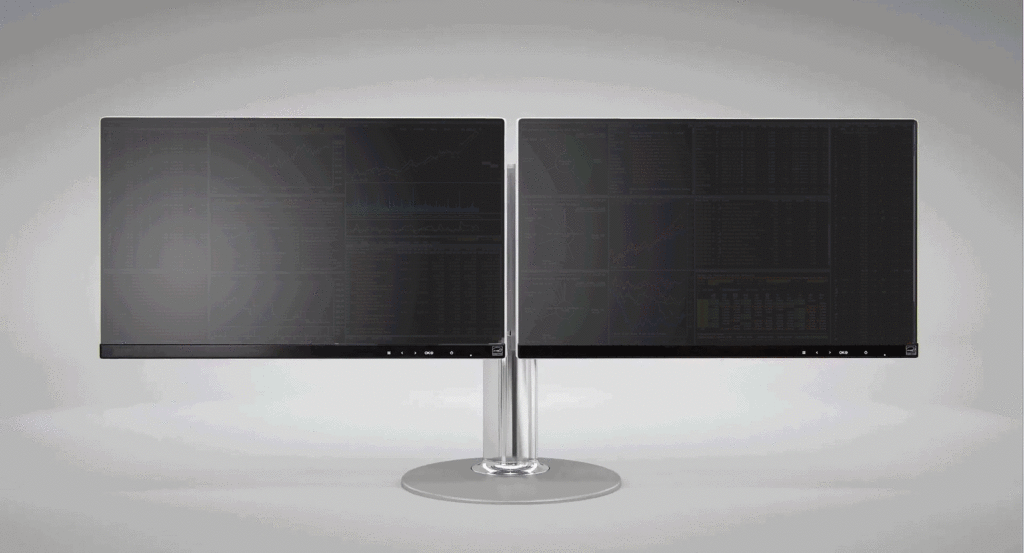
Render of double monitors attached to a single chrome stand. Monitors show a faint palimpsest of an software interface
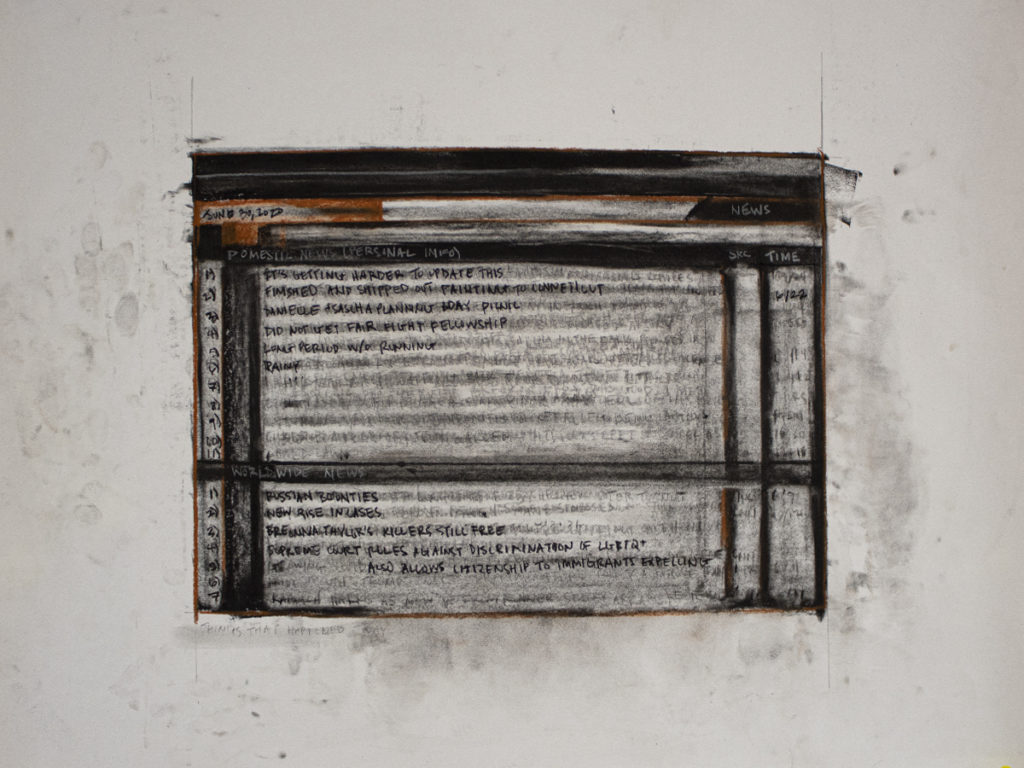
Drawing in black, gray, and orange of a web browser window showing the news.
News, Domestic News (Personal Info) and World Wide News: A list of personal and global headlines. Started April 2, 2020.
Drawing in black, gray, and orange of a web browser window showing the news.
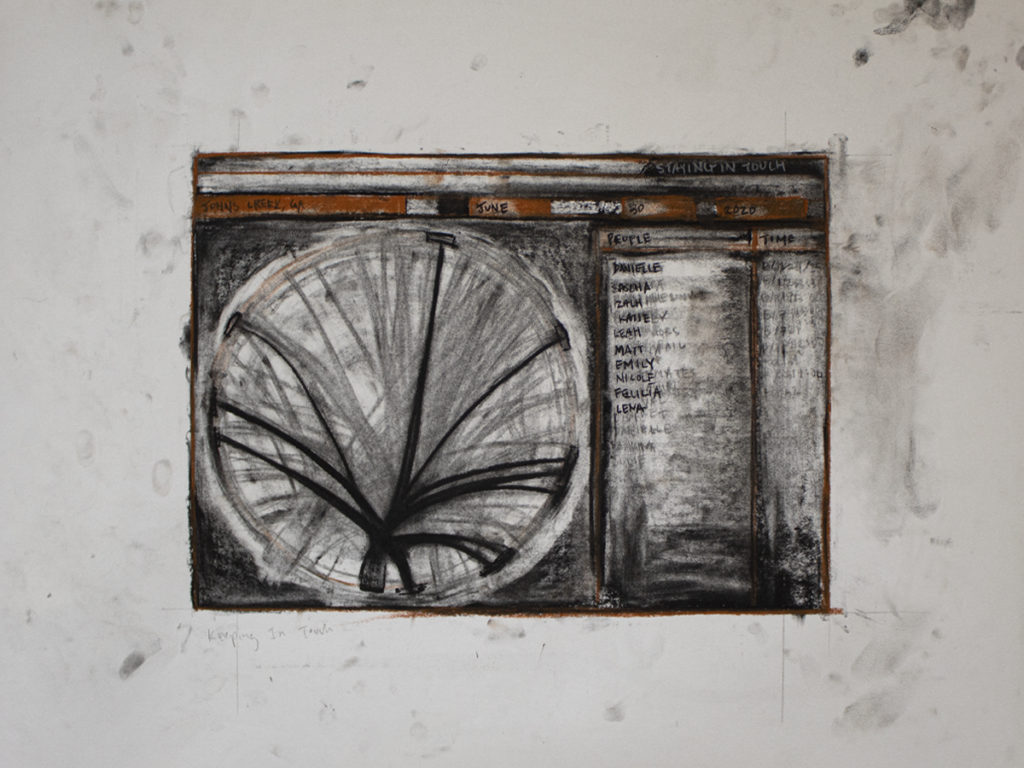
Staying in Touch: A visualization of who I am speaking to and where they are distanced from me. Started April 2, 2020.
Drawing in black, gray, and orange of a web browser window showing the news.
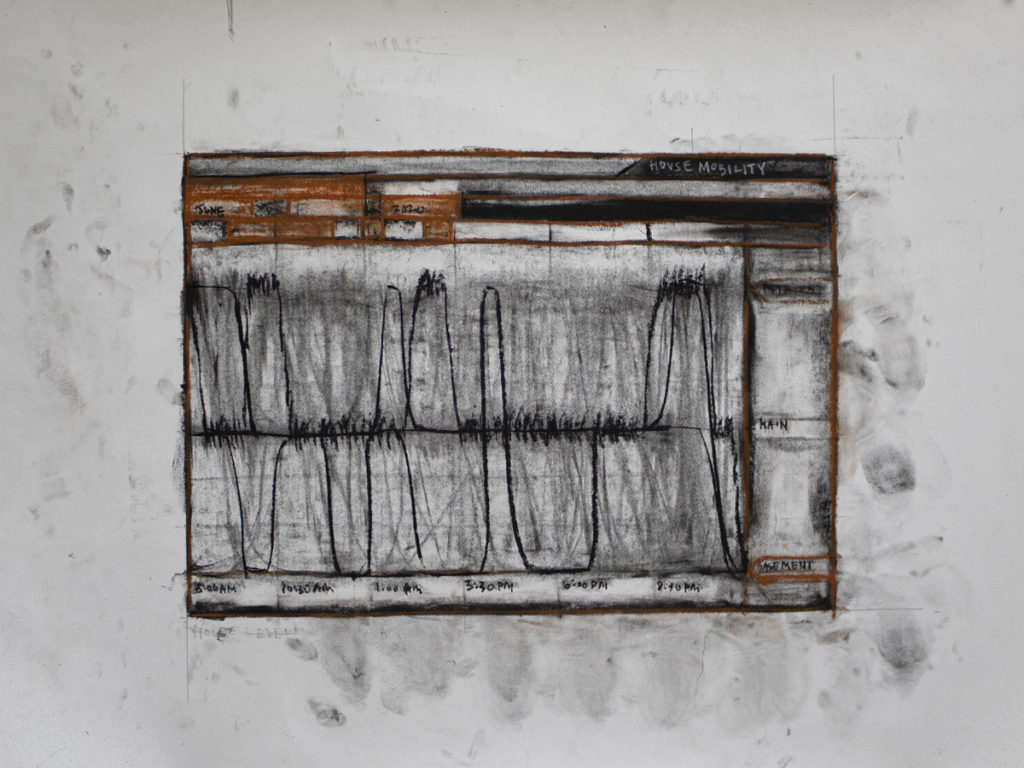
House Mobility: Tracking what level of the house me and my housemates were throughout the day. Started April 4, 2020.
Drawing in black, gray, and orange of a web browser window showing the news.
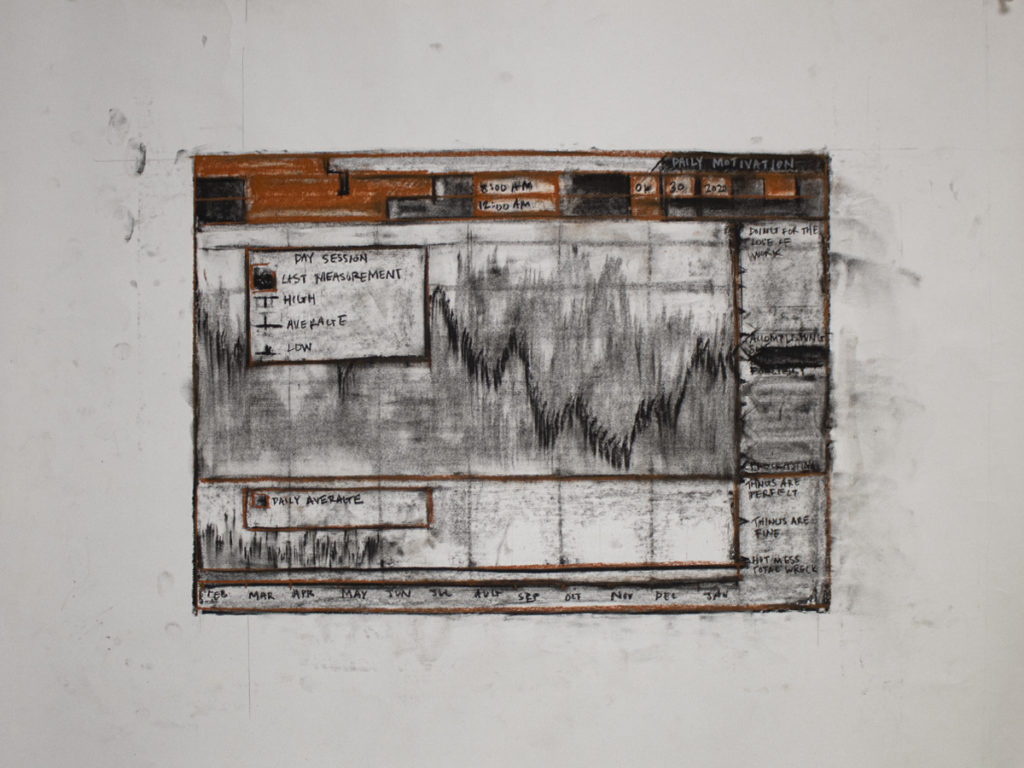
Daily Motivation: When I’m feeling good and when I don’t care to think. Started April 6, 2020.
Drawing in black, gray, and orange of a web browser window showing the news.
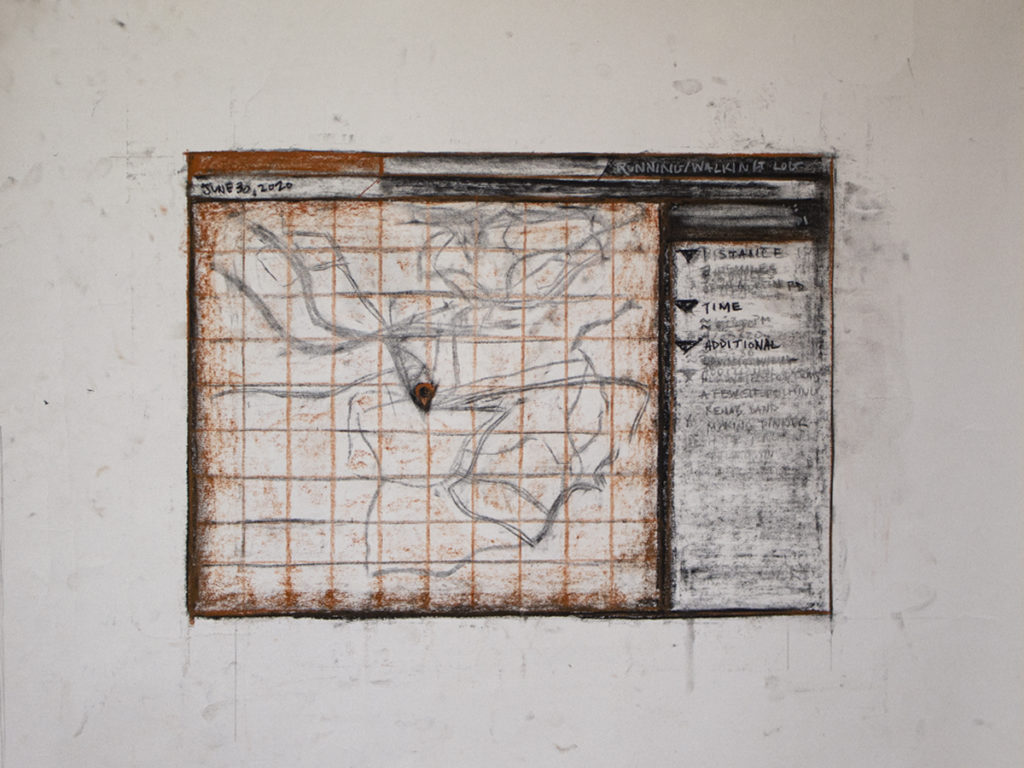
Running/Walking Log: A map and journal of my runs and walks. Started April 6. 2020
Drawing in black, gray, and orange of a web browser window showing the news.
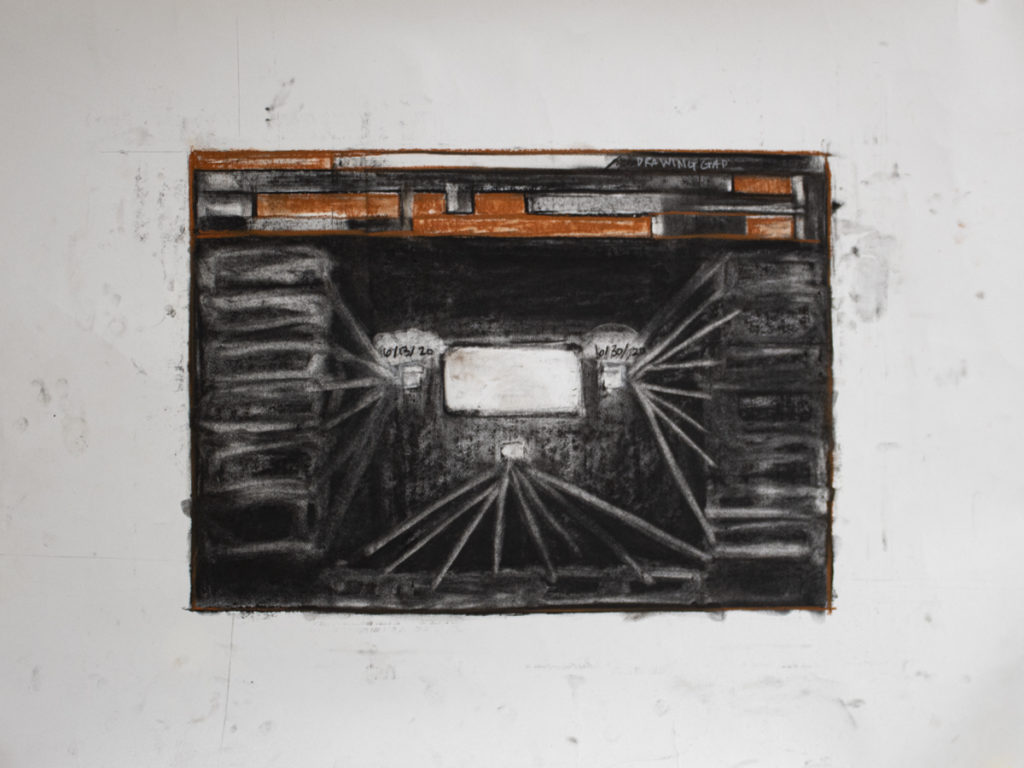
Drawing Gap: Time passed between updating Terminal drawings. Started April 18, 2020.
Drawing in black, gray, and orange of a web browser window showing the news.
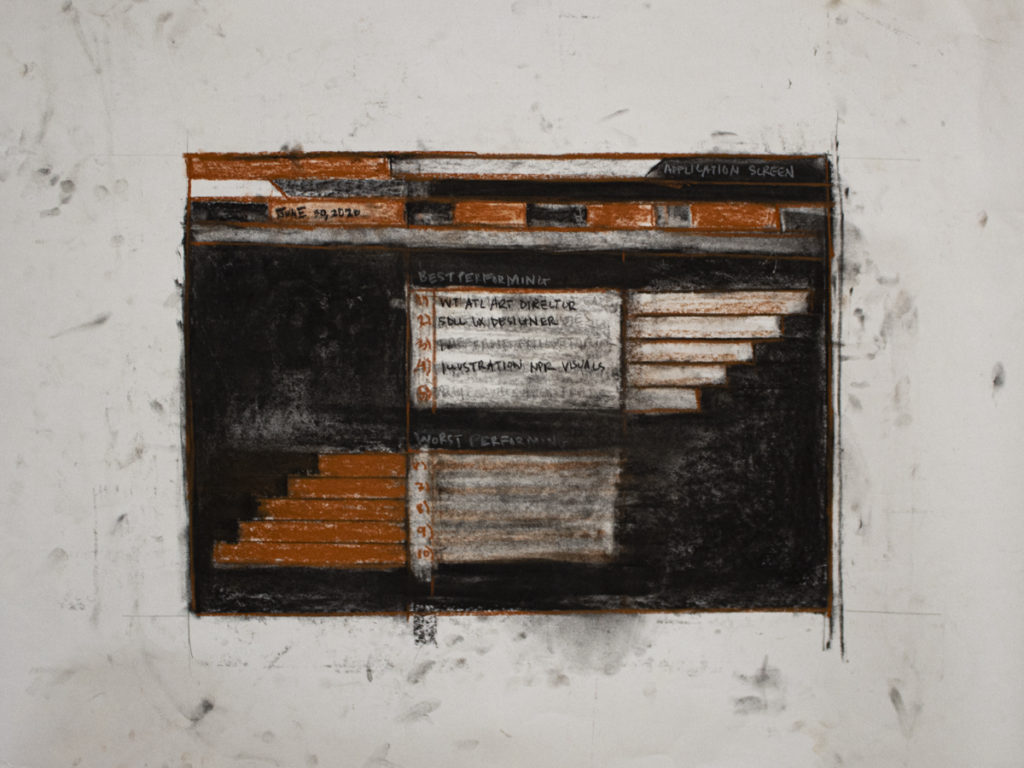
Application Screen: The status and ranking of my career prospects. Started April 25, 2020.
Drawing in black, gray, and orange of a web browser window showing the news.
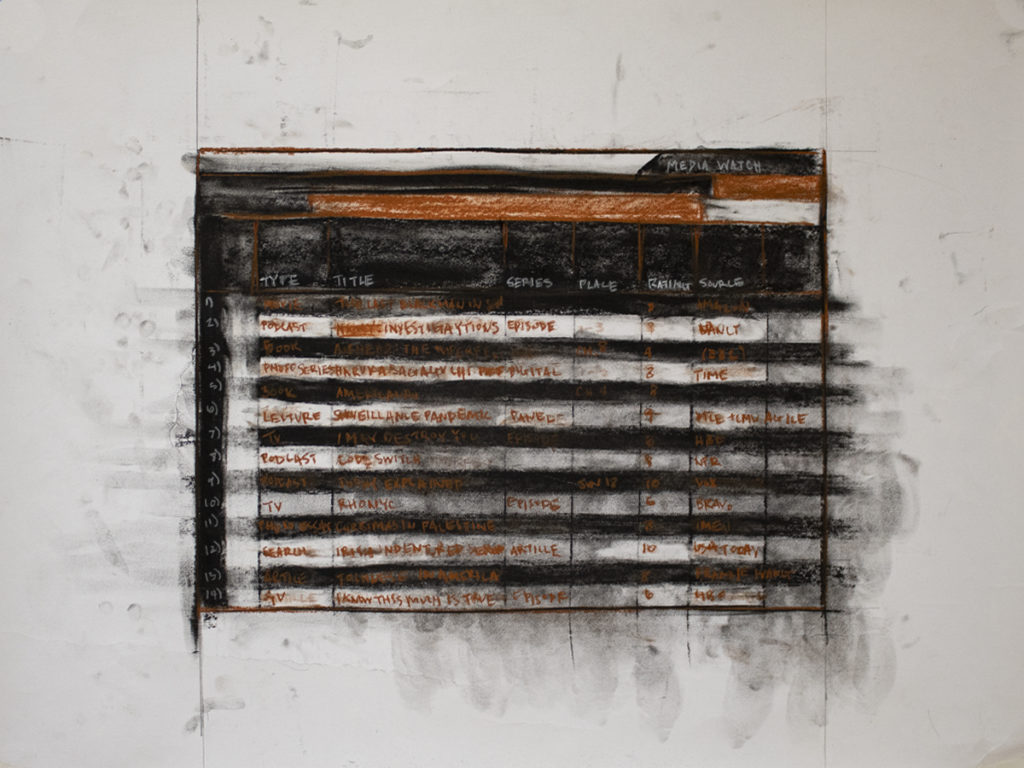
Media Watch: What I’m watching, reading, thinking. Started April 25, 2020.
Drawing in black, gray, and orange of a web browser window showing the news.
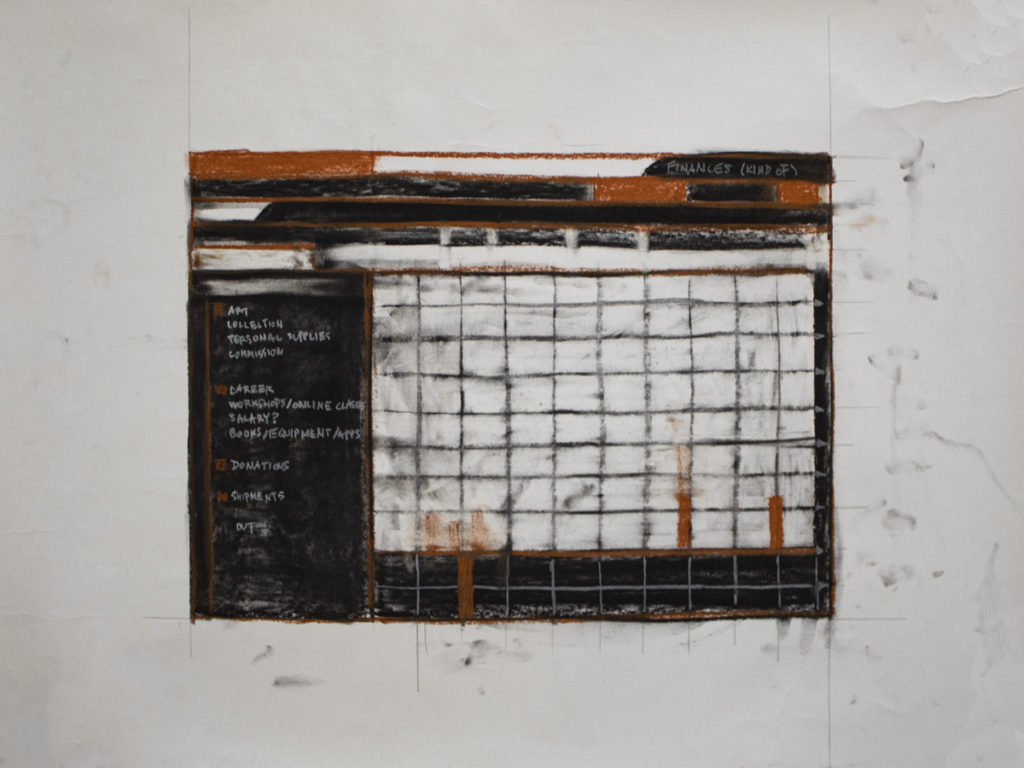
Finances (Kind of): Where the economy is headed from my wallet. Started May 17, 2020.
Drawing in black, gray, and orange of a web browser window showing the news.
Project Progress: A graph of my art’s life. Started June 11, 2020.